
Mastering First Contentful Paint A Developer's Guide
Have you ever clicked on a link and been met with a stark, white screen? That moment of hesitation, wondering if the page is broken or just slow, is exactly what
Have you ever clicked on a link and been met with a stark, white screen? That moment of hesitation, wondering if the page is broken or just slow, is exactly what First Contentful Paint (FCP) is designed to measure. It pinpoints the precise moment the first piece of content—be it text, a logo, or an image—appears on the screen, assuring your visitor that things are happening.
Understanding First Contentful Paint
Think of it like this: you walk into a restaurant and for a moment, no one greets you. You start to wonder if they're even open. But then, a server immediately brings you a glass of water. It's not your meal, but it’s a powerful signal that service has started and you're in the right place. First Contentful Paint is that glass of water for your website.
Technically speaking, FCP is a core user-centric performance metric. It measures the time from when someone lands on your page to the moment the browser renders the very first piece of content from the Document Object Model (DOM).
This initial feedback is absolutely crucial for keeping visitors engaged. A slow FCP creates friction and doubt, often causing people to leave before your site even has a chance to load. A fast FCP, on the other hand, gives immediate reassurance that the page is working, which dramatically improves a user's perception of your site’s overall speed.
Why FCP Is a Pillar of Performance
A good FCP score isn't just a vanity metric; it's a cornerstone of great user experience (UX) and effective search engine optimisation (SEO). As a key part of Google's Core Web Vitals, it has a direct impact on how search engines judge the quality of your website.
The benefits are straightforward:
- Reduces Bounce Rates: When people see something happen quickly, they’re much more likely to stick around.
- Improves User Perception: That initial flash of content makes the entire loading process feel faster.
- Boosts SEO Rankings: Google actively rewards websites that deliver a superior, faster experience to their users.
A fast website isn't just about the final load time; it's about how quickly you can deliver that first piece of visual confirmation. Mastering First Contentful Paint is the first step toward a high-performance website that users and search engines will love.
How to Accurately Measure Your FCP Score
If you want to speed up your First Contentful Paint, you can't just guess what’s wrong. You need solid data. The key is understanding that there are two ways to look at performance: in a controlled test environment and out in the real world. We call these Lab Data and Field Data.
Think of it like this: Lab data is your test kitchen. You have the same oven, the same ingredients, and the same recipe every time. It’s perfect for isolating a problem and seeing if your fix actually works under predictable conditions.
Field data, on the other hand, is what happens when people actually cook your recipe in their own kitchens—some have gas stoves, some have electric, some might even be using a microwave. This data shows you how your site performs for real people on their varied devices and network connections. You need both to get the full picture.
Using Lab Data for Reproducible Tests
The go-to tool for lab testing is Google Lighthouse, which is already built into Chrome DevTools. It runs a simulated test on your page using a standard mid-range device and a decent connection. This gives you a consistent, repeatable baseline.
Why is this so useful? Because you can make a change, run Lighthouse again, and immediately see if your FCP improved. It’s perfect for debugging during development.
Here’s what a typical Lighthouse report looks like. It’s designed for a quick, at-a-glance assessment.
You get a big score out of 100 and a simple colour-coded system: green is good, orange needs work, and red is poor. This instant feedback loop is fantastic for catching performance issues before they ever reach your users.
Gathering Field Data for Real-World Insights
While the lab is great for fixing things, field data tells you what your users are actually experiencing. The best source for this is the Chrome User Experience Report (CrUX). It’s a massive public dataset collected from real Chrome users who’ve opted in to share their performance data.
The easiest way to see your site's CrUX data is through PageSpeed Insights. It pulls FCP scores and other metrics from the last 28 days, showing you the distribution across your audience. You can finally answer the question: "Is our slow FCP a problem for everyone, or just a few users on slow networks?"
Here’s the main takeaway: Lab data helps you diagnose issues in a clean environment. Field data validates that your fixes are actually making a difference for real people.
To make it even clearer, let's break down when to use each approach.
Lab Data vs Field Data for FCP Measurement
This table compares the two main ways of measuring First Contentful Paint, showing you what they’re good for and where they fall short.
| Tool/Method | Data Type | Best For | Pros | Cons |
|---|---|---|---|---|
| Lighthouse (in DevTools) | Lab Data | Debugging, pre-production testing, and getting instant feedback on changes. | Highly consistent, reproducible results. Provides detailed diagnostics and improvement suggestions. | Doesn't capture the variability of real-world user conditions like network or device differences. |
| PageSpeed Insights (CrUX) | Field Data | Understanding the real-world user experience and tracking long-term performance trends. | Reflects how actual users experience your site. Essential for validating Core Web Vitals. | Data is aggregated and delayed (28-day period), making it unsuitable for immediate debugging. |
So, what's the right workflow? Use both. Start with Lighthouse to pinpoint and fix specific FCP bottlenecks in your code. Once you've deployed the changes, turn to PageSpeed Insights to confirm that those improvements are making a tangible difference to your users' experience over time.
This two-step process ensures you’re not just chasing a synthetic score but delivering genuinely better performance.
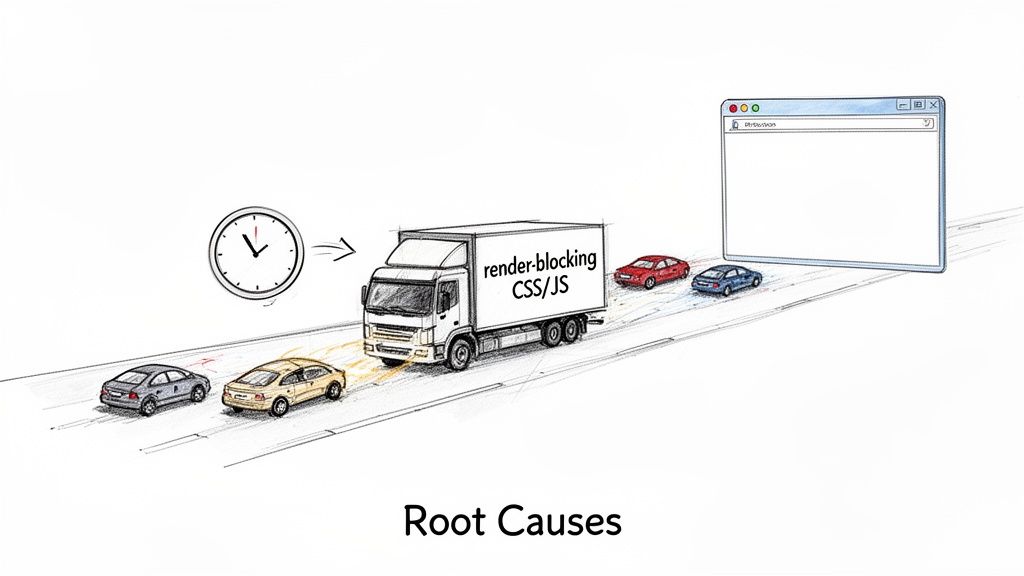
Pinpointing the Root Causes of a Slow First Contentful Paint
Diagnosing a slow First Contentful Paint often feels like playing detective. You know something is wrong—the page is taking too long to show anything—but you need to find the specific bottleneck causing the hold-up. Before you can fix the problem, you have to find the source.
Thankfully, the culprits usually fall into a few common categories. Once you understand what to look for, you can start to build a mental checklist for analysing your own site’s performance and zero in on what’s causing the delay.
Render-Blocking Resources: The Usual Suspects
Think of a web browser as a construction worker building your page from an HTML blueprint. It reads the instructions line by line. But when it gets to a CSS stylesheet or a JavaScript file in the <head>, it has to drop everything. It stops building, goes to fetch that file, and waits to process it before it can move on.
These files are what we call render-blocking resources. They bring the whole construction project to a grinding halt, leaving your visitor staring at a blank white screen. The more of these you have, or the bigger they are, the longer that user has to wait for something—anything—to appear.
The most common offenders are:
- Large CSS Files: The browser needs to know all the styling rules before it can paint the page correctly, so it patiently waits for the entire CSS file to download and be parsed.
- Synchronous JavaScript: Any script loaded without an
asyncordeferattribute will block the HTML from being parsed, preventing the browser from even discovering what else is on the page. - Custom Web Fonts: Each font you use is another network request. If they’re not loaded efficiently, the browser will wait to render any text until the font file arrives, delaying that crucial first paint.
Slow Server Response Times
Before any of the front-end magic can happen, the browser first needs to get the HTML file from your server. The time it takes for your server to receive that request and send back the very first byte of information is called Time to First Byte (TTFB).
A high TTFB is a direct torpedo to your FCP score. It's the first domino to fall; if the server is slow out of the gate, everything that follows is automatically delayed. Common causes range from sluggish backend code and overloaded databases to simply not having enough server power.
A fast server is non-negotiable for a good FCP. Even the most optimised front-end code can't compensate for a server that takes seconds to respond to the initial request.
Large and Unoptimised Page Elements
Finally, the sheer size of the elements needed for that initial screen view plays a massive role. Even if your server is lightning-fast and you have zero render-blocking resources, the browser still has to download the content it’s about to paint.
The most common problem I see here is a huge, unoptimised hero image right at the top of the page. If that image is one of the first things in the HTML, the browser will try to render it for the FCP. But if that image file is several megabytes, the download time alone becomes a major bottleneck.
One blogger shared how unoptimised images straight from storage caused their homepage FCP to skyrocket from under a second to a painful 4.5 seconds. You can read about their image optimization journey to see the real-world impact for yourself.
Getting a handle on these three core areas—render-blocking resources, server response times, and oversized page elements—is the essential first step. By using a tool like Lighthouse to run an audit, you can quickly see which of these is your primary bottleneck and move on to applying the right fixes.
Eliminating Render-Blocking Resources for a Faster FCP
When someone lands on your site, their browser starts to assemble the page from top to bottom, like reading a recipe. But when it hits certain CSS or JavaScript files in the <head>, it has to stop dead in its tracks. This pause, caused by render-blocking resources, is one of the biggest culprits behind a slow First Contentful Paint, leaving your visitor staring at a blank white screen.
The browser halts everything because it needs these files to figure out how to style and arrange the page. To fix this and speed up your FCP, the goal isn't to get rid of these files. It's to change how and when they load so they no longer block that all-important first paint.
Taming Render-Blocking CSS
By default, every single CSS file is render-blocking. The browser refuses to show a single pixel until it has downloaded and processed every style rule you've linked. The trick is to split your CSS into two distinct parts: the absolutely essential styles needed for what the user sees immediately ("above the fold") and everything else.
- Identify Critical CSS: This is the bare-minimum CSS required to style the top portion of the page. You can hunt this down using your browser's DevTools or other online tools designed for the job.
- Inline Critical CSS: Instead of making the browser wait for a separate file to download, you embed this small chunk of CSS directly into a
<style>tag in the<head>of your HTML. This gives the browser everything it needs to render the visible part of the page instantly. - Load Non-Critical CSS Asynchronously: For the rest of your stylesheet, you can load it in a way that doesn't hold things up. A clever technique is to use a
<link>tag with amediaattribute that doesn't initially apply (likemedia="print"), then switch it tomedia="all"once the page has loaded.
This strategy ensures the initial view appears almost immediately, giving the user that instant visual feedback and massively improving your FCP score.
Managing JavaScript for a Faster Start
JavaScript files are often the heaviest offenders. Without any special instructions, a browser will stop parsing the HTML to download, parse, and execute every single script it finds. Thankfully, two simple attributes—async and defer—give you powerful control over this process.
Think of it like building a house. The HTML is the foundation and the frame. JavaScript is the wiring and plumbing that make everything work.
Without
asyncordefer, your construction crew stops framing the house every time an electrician shows up. They just stand around and wait until the wiring is done before they'll put up the next wall. It’s a huge bottleneck.
Using defer and async is like telling your crew to keep building the frame while the specialists get their materials ready in the background.
Choosing Between Defer and Async
While both attributes stop JavaScript from blocking the initial render, they behave a little differently. Understanding the distinction is crucial for using them effectively.
defer****: This tells the browser to download the script in the background while it continues parsing the HTML. The script is guaranteed to run only after the HTML is fully parsed, and in the same order the scripts appear in your code. This is perfect for scripts that need the full page to be ready or depend on other scripts loading first.async****: This also tells the browser to download in the background without blocking. However, it will execute the script the very moment it finishes downloading, regardless of what the HTML parser is doing. This can be great for independent, third-party scripts like analytics trackers, but it offers no guarantee on execution order.
Here’s a simple rule of thumb: if a script isn't essential for the initial paint and its execution order matters, use defer. If it’s a standalone script where order is irrelevant, async is a solid choice. By adding these attributes to your <script> tags, you let the browser focus on what's most important: delivering a lightning-fast First Contentful Paint.
To see how these tweaks fit into the bigger picture, explore our articles on improving Core Web Vitals and how you can get faster page speed with better images.
How to Radically Improve FCP with Image Optimisation
Once you've dealt with render-blocking resources, the next big hurdle for a speedy First Contentful Paint is almost always your images. Those large hero banners and product shots sitting "above the fold" are often the heaviest things a browser has to download for that initial view. Get them wrong, and you can single-handedly tank your FCP score, pushing it from "Good" straight into "Poor."
Think of your webpage like a moving lorry. The HTML and CSS are the vehicle's frame, but the images are the heavy furniture inside. If you try to load a giant sofa first, the whole operation grinds to a halt. Optimising your images is like breaking that sofa down into smaller, more manageable boxes that can be loaded quickly and efficiently.
This goes beyond just making files smaller. It’s about delivering the perfect image for every user—the right format, the right size, and at exactly the right time. Modern web development gives us the tools to do this with incredible precision, turning images from FCP blockers into FCP accelerators.
Serve Next-Gen Formats with Legacy Fallbacks
For years, we all relied on JPEG and PNG. They were the undisputed champions of web images. But now, newer formats like AVIF and WebP have entered the ring, offering far superior compression. This means they can deliver the same (or even better) visual quality at a much smaller file size—we’re often talking savings of 30-50% over their older counterparts.
The only catch? Not every browser supports them yet. That's where the <picture> element comes in. It’s a clever bit of HTML that lets you offer up multiple image sources. The browser goes down the list, grabs the first one it supports, and simply ignores the rest.
This creates the best of both worlds:
- Modern Browsers get the highly optimised AVIF or WebP files, which means a much faster FCP.
- Older Browsers seamlessly fall back to a universally supported format like JPEG, so nobody is left with a broken image.
This strategy is especially powerful in markets like Poland. For Polish e-commerce sites, where images frequently make up 60% of a page's total weight, slower paint times are directly linked to 20-30% higher bounce rates. Developers using a service like PixelFiddler to connect S3 or Google Cloud storage have seen FCP improvements of up to 50% by automatically serving optimised AVIF and WebP formats with these fallbacks. It's a vital advantage, especially as mobile use in the region continues to climb. You can learn more about Poland's mobile network performance and trends to see why this matters.
Implement Responsive Images with Srcset
There’s no bigger waste of bandwidth than sending a gigantic desktop-sized image to a small mobile phone. It’s a classic, direct cause of slow FCP. The srcset attribute is the solution. It lets you create a list of different-sized versions of an image and tell the browser how wide each one is. The browser then does the smart work, picking the best one for the user’s specific screen size and resolution.
This effectively puts the browser in the driver's seat, letting it make the most efficient choice. Someone on a small phone with a shaky connection gets a small, lightweight image. A user on a massive, high-resolution desktop monitor gets the crisp, detailed version they expect.
By using
srcset, you stop forcing a one-size-fits-all solution. Instead, you empower the browser to download only what's necessary, which is one of the most effective ways to speed up the initial render.
Prioritise Critical Images and Defer the Rest
Not all images are created equal, especially when it comes to that first paint. The hero banner at the top of your homepage is absolutely essential for the FCP, but the company photos in your footer definitely are not. This is where strategic loading makes a huge difference.
- Preload Critical Above-the-Fold Images: For the one or two images that are absolutely vital for that initial view (like your main banner), you can give the browser a heads-up with
<link rel="preload">. This tells the browser to start downloading that specific image with high priority, long before it even finds the<img>tag in the HTML. - Lazy Load Everything Else: For every image that is not visible when the page first loads, you should use native lazy loading. Just add the
loading="lazy"attribute to the<img>tag. This tells the browser not to even bother downloading the image until the user scrolls close to it, saving precious bandwidth and focusing all initial resources on the critical content.
Automate Your Workflow with a URL-Based API
Let's be honest: managing all these optimisations by hand is a nightmare. Creating different formats, resizing for a dozen srcset versions, and keeping it all organised is a recipe for errors and wasted time. This is where an image optimisation API, like PixelFiddler, completely changes the game.
Instead of manually processing every image, you can apply these optimisations on the fly using simple URL parameters. A good API can automatically detect the user's browser capabilities and device characteristics.
This automated approach handles all the complexity for you:
- It serves WebP or AVIF to supported browsers and falls back to JPEG for others.
- It generates responsive sizes instantly for your
srcsetattributes. - It applies smart compression and quality adjustments based on network conditions.
This means you can store one high-quality original image and let the service handle the delivery of perfectly optimised versions for every single user. This doesn't just radically improve your First Contentful Paint; it also simplifies your entire development process, freeing you up to focus on what matters most: building a great experience. For more on this, our articles on improving Core Web Vitals and achieving faster page speed with images offer even more practical advice.
Shaving Off Milliseconds: Advanced FCP Techniques
Once you’ve sorted out your images and cleared away render-blocking resources, the next level of FCP optimisation is all about fine-tuning. We're getting into the nitty-gritty of how browsers handle assets and talk to servers. These advanced tweaks focus on chipping away at those crucial milliseconds that, when added up, make for a much snappier first render.
A classic culprit holding back FCP is web font delivery. Fonts are often render-blocking by default, meaning the browser waits to download the entire font file before showing any text. This delay, often seen as a flash of invisible text, is a direct hit to your FCP score.
Fine-Tuning Asset and Connection Priorities
The good news is you can take charge of the loading process. A great first step is to add a <link rel="preload"> tag for your most important font files right in the HTML <head>. This is like giving the browser a heads-up, telling it to fetch those fonts with high priority, long before it would normally think to.
Combine that with a simple CSS property: font-display: swap. This instruction tells the browser to be practical—show the text immediately with a standard system font, then simply "swap" in your custom font once it arrives. The result? Your text is visible almost instantly, which nails the FCP metric, and your beautiful typography still gets to make its appearance.
This two-pronged attack—preloading and swapping—ensures your FCP is never held hostage by a slow-loading font file. The user sees something meaningful right away, which is precisely what this metric is all about.
Another major speed bump can be your server's response time, often called Time to First Byte (TTFB). This is the time it takes for your server to even start sending the first piece of your website. A Content Delivery Network (CDN) is one of the most effective ways to slash this delay.
Think of a CDN as a global network of servers that keeps copies (a cache) of your site's assets. When someone in Warsaw visits your site, they get the content from a server in Europe, not one on the other side of the planet. It’s a game-changer. Even browser developers aim for FCPs under 300ms because they know anything longer frustrates users. A CDN is practically essential if you want to hit that target for a global audience.
Establishing Early Connections to Third-Party Domains
Most sites today lean on resources from other domains for things like analytics, ads, or APIs. For each new domain, the browser has to do a whole song and dance: look up the DNS, establish a TCP connection, and perform an SSL handshake. All of this adds up.
You can give the browser a head start with a couple of resource hints:
dns-prefetch: This is a lightweight hint that just tells the browser to sort out the DNS for a specific domain ahead of time. It's a quick and easy way to save a few milliseconds.preconnect: This one is more powerful. It handles the DNS lookup, the TCP handshake, and the SSL negotiation. Because it does more work, you should use it sparingly—only for your most critical, must-have third-party connections.
By putting these advanced strategies into practice, you’re moving beyond the basics and optimising the entire network and rendering pipeline. For more tips on boosting your site's performance, dive into our articles on enhancing your Core Web Vitals and achieving faster page speed through image optimisation.
Your FCP Questions, Answered
Getting to grips with web performance metrics often sparks a few questions. To clear things up, I’ve put together some straightforward answers to the queries I hear most often about First Contentful Paint.
Think of this as a final check-in to make sure you have a solid handle on how to improve that critical first impression your site makes.
What Is a Good First Contentful Paint Score?
According to Google's benchmarks, a "Good" FCP is 1.8 seconds or less. Hitting this target makes your site feel quick and responsive right from the get-go.
If your FCP is between 1.8 and 3.0 seconds, it’s categorised as "Needs Improvement." Anything over 3.0 seconds is considered "Poor." To stay on the right side of Core Web Vitals, you should aim for at least 75% of your page loads to meet that "Good" benchmark.
How Is FCP Different from LCP?
It's helpful to think of it as the opening act versus the headliner.
First Contentful Paint (FCP) marks the very first moment something visual—like text, a logo, or a background colour—renders on the screen. It's the initial proof that the page is actually loading.
On the other hand, Largest Contentful Paint (LCP) waits until the largest, most meaningful piece of content (usually a hero image or a big heading) has appeared. FCP tells the user "we're starting," while LCP tells them "the important stuff is here."
Can I Improve FCP Without Optimising Images?
Yes, definitely. While images are often the biggest culprits, they aren't the only thing holding back your FCP. You can make some serious headway by tackling other issues first.
Start by getting rid of render-blocking resources. That means inlining the essential CSS your page needs to paint the initial viewport and adding a defer attribute to non-critical JavaScript.
Another huge win comes from improving your server's response time, or Time to First Byte (TTFB). A faster server or a good CDN can give your FCP a direct boost before you even think about an image file.

Ready to stop wrestling with manual image optimisation and deliver a faster FCP automatically? PixelFiddler connects to your existing storage and serves perfectly optimised images to every user on the fly. Start for free and see the difference in minutes.